Energy Bills Basics
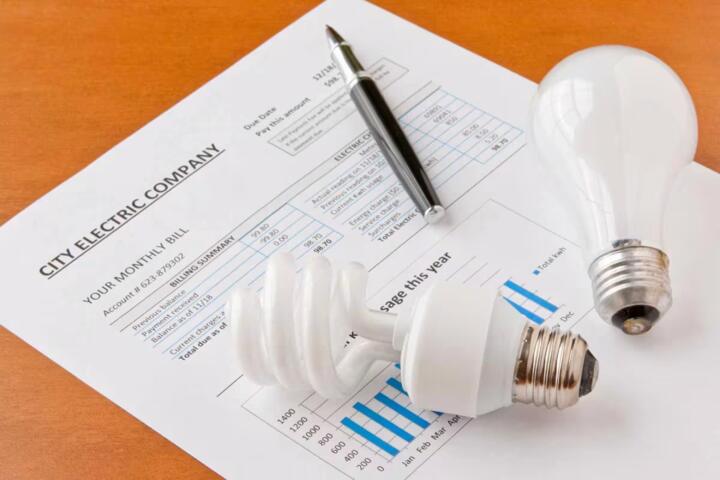
An energy bill is a summary of three things: how much energy you used, what price you paid for that usage, and which add-ons your utility or government applied. Most confusion comes from the bill mixing those pieces across multiple lines and time periods, sometimes with different rate types in the same month.
Two numbers anchor the whole document: your metered usage (often shown as kWh for electricity or therms for natural gas) and your billing period dates. In the U.S., electricity bills commonly show usage in kilowatt-hours, and many utilities also show a “delivery” component separate from “supply.” That split matters because delivery charges can change even when your usage stays flat.
Common Billing Mistakes
People often misread the bill by treating every line as “usage cost.” Delivery charges, riders, and taxes can be separate from the commodity price. If you compare two bills without separating those parts, you can mistake a rate change for a usage change.
Another frequent error is ignoring the billing period dates. A bill covering 31 days will naturally show higher usage than a bill covering 28 days, even with the same daily consumption. The fix is to compare usage per day, not just the total kWh or therms.
Biological mechanisms do not directly apply to energy bills, but the human side does: stress rises when bills feel unpredictable, and that stress can lead to rushed decisions like switching plans without checking contract terms. In real households, that can create avoidable costs such as early termination fees or losing a discount that required enrollment.
How To Decode Each Line
Start With Dates And Usage
Write down the billing period start and end dates, then record the metered usage totals (kWh and/or therms). Convert to a daily rate by dividing total usage by the number of days in the billing period. This quick normalization helps you compare month to month without being fooled by a longer billing cycle.
In practice, you can do this in a spreadsheet or a calculator app. If your bill shows 900 kWh over 30 days, that’s 30 kWh/day. If next month shows 930 kWh over 31 days, the daily rate is about 30 kWh/day again, which suggests the change in dollars may come from rates or add-ons rather than usage.
When the bill shows “estimated” usage, treat the daily comparison as a provisional signal. Utilities often correct estimates after an actual meter read, so a later bill may shift the totals.
Separate Supply From Delivery
Find the sections labeled like “supply,” “generation,” “delivery,” or “distribution.” Electricity bills in deregulated areas often separate commodity supply from wires delivery; regulated areas may still show both components. Your goal is to identify which part changed when your total cost changed.
In practice, compare unit prices. If supply is priced per kWh and delivery is priced per kWh or per month, a change in either can move your total. Some bills show a fixed monthly service charge plus variable per-unit charges; that structure makes totals rise even when usage drops slightly.
A small aside: some utilities label the delivery portion as “T&D” (transmission and distribution). The label varies, but the bill usually includes a line item that makes it clear which dollars are tied to wires versus energy generation.
Check Rate Plans And TOU Buckets
If your bill lists time-of-use categories, record each bucket’s kWh and its corresponding rate. TOU plans price energy differently by time window, so a household can reduce total kWh and still pay more if more usage occurred in on-peak hours.
To see what happened, compare your bill’s on-peak and off-peak usage to your typical schedule. If you run laundry, dishwashing, or EV charging mainly during on-peak hours, the bill will reflect that pattern. The bill may also show a “baseline” or “tier” structure for some tariffs, where higher usage blocks cost more per unit.
When the bill includes a “metered interval” or “measured demand” section, it’s a sign the utility is using interval data. That means your peak timing matters, not just your total energy.
Understand Demand Charges And Peaks
Look for a line item that mentions “demand,” “peak,” “kW,” or “maximum demand.” Demand charges are based on the highest short interval demand during the billing period, not the total kWh. If your tariff includes demand, a single event can raise the bill even if monthly kWh stays steady.
In practice, you can reduce demand peaks by spreading high-load activities. Examples include running HVAC cycles at different times, avoiding simultaneous start-up of large appliances, or adjusting EV charging to off-peak windows if your plan supports it.
Some bills show the measured peak value and the rate per kW. If you want a sanity check, compare that peak kW to what your home’s major loads could produce. A central air conditioner plus electric water heater plus an oven can create a peak that surprises people who only track energy usage.
Read Taxes, Riders, And Credits
Taxes and regulatory charges can be calculated as a percentage of certain subtotals or as fixed per-unit add-ons. Riders may fund specific programs such as renewable energy, energy efficiency, or low-income assistance. Credits can offset charges from prior overpayments or from participation in a program.
To interpret this section, identify the base amount each tax applies to. Some bills apply taxes to the entire bill total; others apply them only to specific components. If you see a tax line that changes sharply while usage stays similar, the base subtotal likely changed due to supply or delivery rate shifts.
Also check for one-time adjustments. A credit labeled “prior period” or “true-up” can make the current month look unusually low or high.
Use Your Meter Or App For Cross-Checks
When available, compare the bill’s usage to your meter reading or to the utility’s customer portal. Smart meter portals often show daily or hourly usage, which helps you verify whether the bill’s totals match your expectations.
A practical cross-check: if your portal shows you used about 30 kWh/day and the bill shows 900 kWh for a 30-day period, the numbers align. If they don’t, the mismatch may come from estimated reads, meter rollovers, or a billing period date mismatch.
Some portals show a version number in the interface footer or a “last updated” timestamp. On one utility portal I reviewed in 2024, the usage chart refreshed with a delay after meter data arrived, which can confuse people who check the portal the same day the bill is generated.
Two Case Examples
Case 1: Same Usage, Higher Total
A renter sees their electricity bill rise from $140 to $175 while monthly kWh stays close: 780 kWh in one month and 800 kWh in the next. The bill shows a higher delivery unit rate and a larger fixed monthly service charge. The supply line also includes a different per-kWh price due to a tariff change. The renter reduces usage slightly but still pays more because the rate structure changed and the fixed charge increased.
Case 2: TOU Shift Causes Surprise
A household on a time-of-use plan notices a higher bill after switching to an EV charging schedule. The bill shows off-peak kWh dropping while on-peak kWh rises, even though total kWh is similar. The on-peak rate is higher, so the total cost increases. The household adjusts charging to off-peak hours and watches the next bill’s on-peak bucket to confirm the change.
Checklist And Comparison
Use this checklist to decide whether your bill change comes from usage, rates, or add-ons. It’s designed for decision support, not plan sales.
| Check | What To Look For | Likely Cause If It Changes | What To Do Next |
|---|---|---|---|
| Billing dates | Start/end dates and days | Longer cycle inflates totals | Compare usage per day |
| Usage totals | kWh, therms, tiers | Behavior or weather shift | Cross-check with meter/app |
| Unit rates | $/kWh or $/therm lines | Rate change or plan change | Compare to last bill’s rates |
| Demand/kW | Peak demand and rate | Short peak event | Adjust timing of high loads |
| Taxes and riders | Tax base and rider lines | Policy or subtotal change | Check which subtotal changed |
Step-by-step checklist: (1) Confirm billing dates and days, (2) compute usage per day, (3) separate supply, delivery, and fixed charges, (4) check TOU tiers and on-peak/off-peak buckets, (5) look for demand/kW lines, (6) review taxes/riders/credits, (7) cross-check with meter/app if available, (8) dispute only after you can point to a specific mismatch.
Mistakes That Cost Money
One mistake is comparing total bill amounts without normalizing for billing period length. Another is focusing on the “total due” figure while ignoring fixed charges that can rise even when usage falls.
People also misinterpret estimated reads. If a bill uses estimates, the next bill can correct them, so a short-term spike may not reflect a real usage change. Treat estimated reads as a prompt to check the meter rather than a reason to panic.
Plan switching can backfire when contract terms include early termination fees or when discounts require enrollment. Some discounts apply only to the supply portion, not delivery, so the bill may not drop as much as expected.
Another recurring issue is overlooking demand charges. Households that track only kWh may miss that a peak in kW can dominate the bill. If your tariff includes demand, timing and load management matter.
FAQ
What Does kWh Mean On My Bill?
kWh stands for kilowatt-hours and measures electricity energy used over time. Your bill converts kWh into dollars using the rate structure shown on the statement, which may include different prices for on-peak and off-peak hours.
Why Did My Bill Rise With Similar Usage?
Rates can change, fixed monthly charges can increase, and taxes or riders can apply to different subtotals. Demand charges can also rise when peak kW increases even if total kWh stays similar.
How Can I Tell If My Usage Was Estimated?
Look for labels such as “estimated,” “actual,” or “meter read type” near the usage section. If the bill uses estimated reads, compare with the utility portal or the next bill that includes an actual meter read.
What Is The Difference Between Supply And Delivery?
Supply covers generation or commodity energy, while delivery covers the wires and related services that move electricity to your home. Some bills show both separately so you can see which component changed.
Should I Dispute A Bill If It Looks Wrong?
Dispute when you can point to a specific mismatch, such as usage far outside your normal range without a plausible reason, incorrect billing dates, or a clear meter read error. Contact the utility’s billing support and follow your local regulator’s complaint process if needed.
Author's Insight
Energy bills look confusing because they combine multiple pricing mechanisms: variable per-unit charges, fixed monthly fees, time-based buckets, and sometimes demand charges. The most reliable way to interpret them is to anchor on billing dates and metered usage, then map each dollar line to a rate type. When you cross-check with your meter or utility portal, you can separate “my behavior changed” from “the tariff changed.” If the bill still does not reconcile after those checks, a formal billing dispute with specific evidence is the next step.
Key Takeaways
- Normalize by billing period length: compare usage per day, not just total kWh or total dollars.
- Separate supply, delivery, fixed charges, taxes, riders, and credits so you know what actually changed.
- For TOU plans, compare on-peak and off-peak kWh buckets, not only total usage.
- If demand charges appear, track peak kW and adjust timing of high-load activities.
- Cross-check with your meter or utility portal when available, especially when the bill uses estimated reads.
- Seek professional help from your utility’s billing team or a local regulator if you find a specific mismatch that does not resolve through standard support channels.